CloudWatch
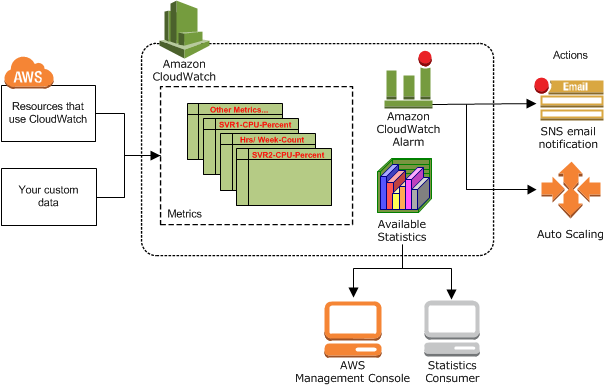
Amazon CloudWatch is basically a metrics repository. It is hosted in the AWS Public Zone, which allows for monitoring of on-premise resources with no additional network configuration.
Namespaces: A namespace is a container for related CloudWatch metrics. Metrics in different namespaces are isolated from each other. There is no default namespace.
The default namespace for AWS services is AWS/<service_name> (E.g.: "AWS/EC2").
Metrics: a time-ordered set of data points that are published to CloudWatch. Metrics are uniquely defined by:
-
A Name
-
A Namespace
-
0 or more dimensions
Timestamps: Each metric data point must be associated with a time stamp. The time stamp can be up to two weeks in the past and up to two hours into the future. If you do not provide a time stamp, CloudWatch creates a time stamp for you based on the time the data point was received. Time stamps are dateTime objects, with the complete date plus hours, minutes, and seconds (for example, 2016-10-31T23:59:59Z).
Dimensions: name/value pair that is part of the identity of a metric. You can assign up to 30 dimensions to a metric. CloudWatch treats each unique combination of dimensions as a separate metric, even if the metrics have the same metric name. You can only retrieve statistics using combinations of dimensions that you specifically published. The exception is by using the metric math SEARCH function, which can retrieve statistics for multiple metrics
Resolution:
-
standard resolution: one-minute granularity.
-
high resolution: one-second granularity.
Period: time between datapoints. Can be 1, 5, 10, 30 or any multiple of 60.
Metrics exist only in the Region in which they are created. Metrics cannot be deleted, but they automatically expire after 15 months if no new data is published to them. Data points older than 15 months expire on a rolling basis; as new data points come in, data older than 15 months is dropped.
Metrics
Retention of metrics depends on the period:
-
Data points with a period of less than 60 seconds are available for 3 hours. These data points are high-resolution custom metrics.
-
Data points with a period of 60 seconds (1 minute) are available for 15 days.
-
Data points with a period of 300 seconds (5 minutes) are available for 63 days.
-
Data points with a period of 3600 seconds (1 hour) are available for 455 days (15 months)
Data points that are initially published with a shorter period are aggregated together for long-term storage. For example, if you collect data using a period of 1 minute, the data remains available for 15 days with 1-minute resolution. After 15 days this data is still available, but is aggregated and is retrievable only with a resolution of 5 minutes. After 63 days, the data is further aggregated and is available with a resolution of 1 hour.
Alarms
-
Metric alarms: they watch a single CloudWatch metric or the result of a math expression based on CloudWatch metrics. The alarm performs one or more actions based on the value of the metric or expression relative to a threshold over a number of time periods.
-
Composite alarms: they watch other alarms (metric or composite) and fire when all the conditions defined in the rule evaluate to true. They can reduce the alarm noise. They’re not supported for cross-account scenarios.
While an alarm invokes actions only when the alarm changes state, Autoscaling Groups alarms continue to fire once per minute while they’re in the ALARM state.
Default resolution for alarms is 1 minute. High-resolution alarms can be set to 10 or 30 seconds for higher charges.
There’s no limit to the amount of alarms you can create.
You can create alarms for custom metrics before creating those custom metrics.
With Amazon CloudWatch cross-account observability, you can monitor and troubleshoot applications that span multiple accounts within a Region.
States:
-
OK -
ALARM -
INSUFFICIENT_DATA
Datapoint states:
-
Not breaching(within the threshold) -
Breaching(violating threshold) -
Missing: no data. What to do?
Alarm evaluation
When you create an alarm, you specify three settings:
-
Period: length of time to use to evaluate in seconds.
-
Evaluation Period: the number of most recent periods/data points to evaluate.
-
Datapoints to alarm: how many breaching data points in the evaluation period are needed to trigger the alarm. They don’t need to be consecutive but they must be in the evaluation period.
If period is 1 min or longer the alarm is evaluated every minute.
For example, if the Period is 5 minutes (300 seconds) and Evaluation Periods is 1, then at the end of minute 5 the alarm evaluates based on data from minutes 1 to 5. Then at the end of minute 6, the alarm is evaluated based on the data from minutes 2 to 6.
When you configure Evaluation Periods and Datapoints to Alarm as different values, you’re setting an "M out of N" alarm.
The number of evaluation periods for an alarm multiplied by the length of each evaluation period can’t exceed one day
CloudWatch Logs
CloudWatch is hosted in the AWS Public Zone, so it can be used on-premise without particular networking configuration.
Concepts
-
Log Class:
-
The Standard log class is a full-featured option
-
The Infrequent Access log class is a lower-cost option for logs that you access less frequently. It supports a subset of the Standard log class capabilities.
-
-
Log events: a record of some activity recorded by the application or resource being monitored. E.g.: a line in the apache access log
-
Log streams: a sequence of log events that share the same source. E.g.: all the lines coming from the apache access logs from one instance.
-
Log Group: groups of log streams that share the same retention, monitoring, and access control settings. E.g.: All the streams from an ASG of EC2 instances running the Apache webserver whose logs are being streamed. You can export the log group data to an S3 bucket (encryption of the bucket is supported but DSSE-KMS). Data can also be exported to OpenSearch but you may incur in high usage charges for large amounts of data.
-
Metric filters: filters to log events that capture data to export as a metric. You can give dimensions and a unit to the metric.
Log Classes
Standard Log Class
-
Fully managed log ingestion and storage
-
Cross-account features
-
Encryption with AWS KMS
-
CloudWatch Logs Insights query commands
-
CloudWatch Logs Insights discovered fields
-
Natural language query assist
-
CloudWatch Logs Anomaly Detection
-
Compare to previous time range
-
Subscription filters
-
Export to Amazon S3
-
GetLogEvents and FilterLogEvents API operations
-
Metric filters
-
Container Insights log ingestion
-
Lambda Insights log ingestion
-
Sensitive data protection with masking
-
Embedded metrics format